
New exhibit lays bare legacy of racist U.S. housing policy


Gregory Jost is someone who likes to make connections, and figure out why things are the way they are.
“When I was a kid growing up in north Jersey, I very quickly realized how segregated our towns were,” said Jost, himself the son of a white father and a south Indian mother. “So, you notice when you don’t fit in, but you also kind of realize how things are set up and divided.”
The fruits of Jost’s curiosity have culminated in the form of “Undesign the Redline,” a traveling interactive exhibit examining the impact “redlining” — the controversial practice of denying loans and mortgages to neighborhoods with low-income and minority populations — has had on cities across the country.
Devised by Jost and studio Designing the We, the exhibit is now on display at the Tremont Health Action Center at 1826 Arthur Ave., where admission is free to the public. After opening in late January, “Undesign the Redline” will remain there through March 30.
Redlining began at the height of the Great Depression after the 1934 creation of the Federal Housing Administration, which dispensed low-cost mortgages and loans to American homeowners on the brink of foreclosure. In 1935, the FHA tasked the newly created Home Owners’ Loan Corp. to survey neighborhoods across 239 U.S. cities and create “residential security maps.” These maps, in turn, assessed the “safety” of a real estate investment in a given area.
To simplify their appraisal system, the loan corporation surveys used colors and letters —green A, blue B, yellow C and red D — to distinguish areas from one another.
Green neighborhoods were considered “optimal” investments, while blue areas were thought of as nearly as good. Meanwhile, neighborhoods shaded in yellow or red were considered undesirable for investing, and the FHA, Veterans Affairs and private banks refused to lend to homeowners living in these areas.
“When you redline a neighborhood, you as (a) bank are writing off the neighborhood, and this becomes a self-fulfilling prophecy,” Jost said. “If you’re saying that ‘this neighborhood is a risky investment and it’s probably going to deteriorate,’ but by setting off access to financing, you’re ensuring that it will actually deteriorate.”
Jost, who also is an adjunct professor at Fordham University, was first introduced to redlining while working for the University Neighborhood Housing Program, a community-based nonprofit that provides housing information and resources to those living in the northwest Bronx. He later found this practice was fatal to areas not marked green or blue — many of which were located in the Bronx — cutting off homeowners from any type of financing.
That resulted in a rapid decay in that area’s quality of life.
However, a much different fate met neighborhoods deemed “safe” by the federal government’s evaluators.
In the loan corporation’s 1938 maps of New York City, only a handful of communities were considered “first rate,” including Fieldston and parts of North Riverdale and Spuyten Duyvil. On these same maps, Van Cortlandt Village is blue, while parts of Kingsbridge alternate in differing shades of lender desirability between blue and yellow.
In the blue and green areas, one would “have access to very low-cost government money,” Jost said, “both for the development and construction of housing.” Having access to that type of credit meant people living in these areas were able to accumulate wealth via home ownership, which they could then hand down to their children.
In determining the risk associated with an area, loan corporation surveyors were given explicit instructions for how they should rate neighborhoods.”
For example, surveyors redlined neighborhoods like Tremont, Claremont and Morrisania for “Negro and Puerto Rican infiltration.” Meanwhile, Riverdale was looked upon favorably by the redline cartographers despite the fact they found “a tuberculosis home near the southern portion of this area.”
“What they did was collapse race and place,” Jost said. Redlining takes “very explicitly racist ideas and transforms them into the structure of society. It’s a ‘structuralization.’”
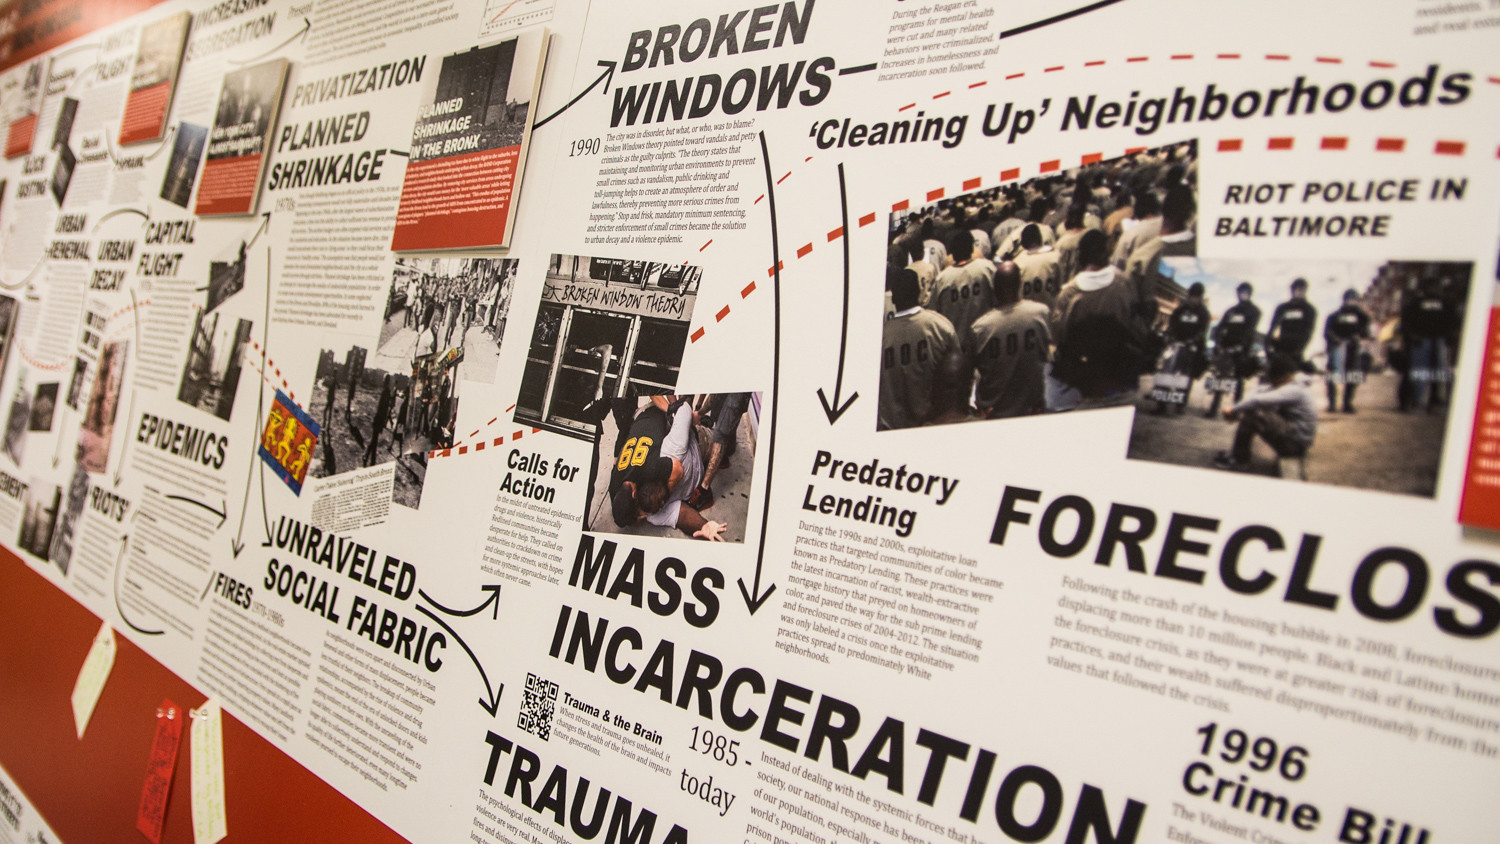
And, once the city’s economic prospects soured in the 1970s, government officials turned to redlining maps as a how-to guide for cutting municipal services — such as access to the fire department — in an effort to save cash. It was a practice, Jost said, known as “planned shrinkage.”
“At that point, the neighborhoods in the Bronx, especially in the South Bronx, had essentially fallen apart,” said Richard Conley, senior vice president at Community Preservation Corp., founded in 1974 to help finance the rebuild of the city’s decaying neighborhoods.
Redlining came to an end in 1977 with the passage of the Community Reinvestment Act, but the law has garnered a mixed reception, with critics pointing to the fact it failed to address the racial wealth disparities caused by redlining.
According to a 2012 data map from research firm Esri, the median net worth for a household in Riverdale is $83,000. For the vast majority of the rest of the Bronx, the median net worth is below $15,000. Both figures remain dwarfed by the sheer amount of wealth concentrated in parts of Manhattan.
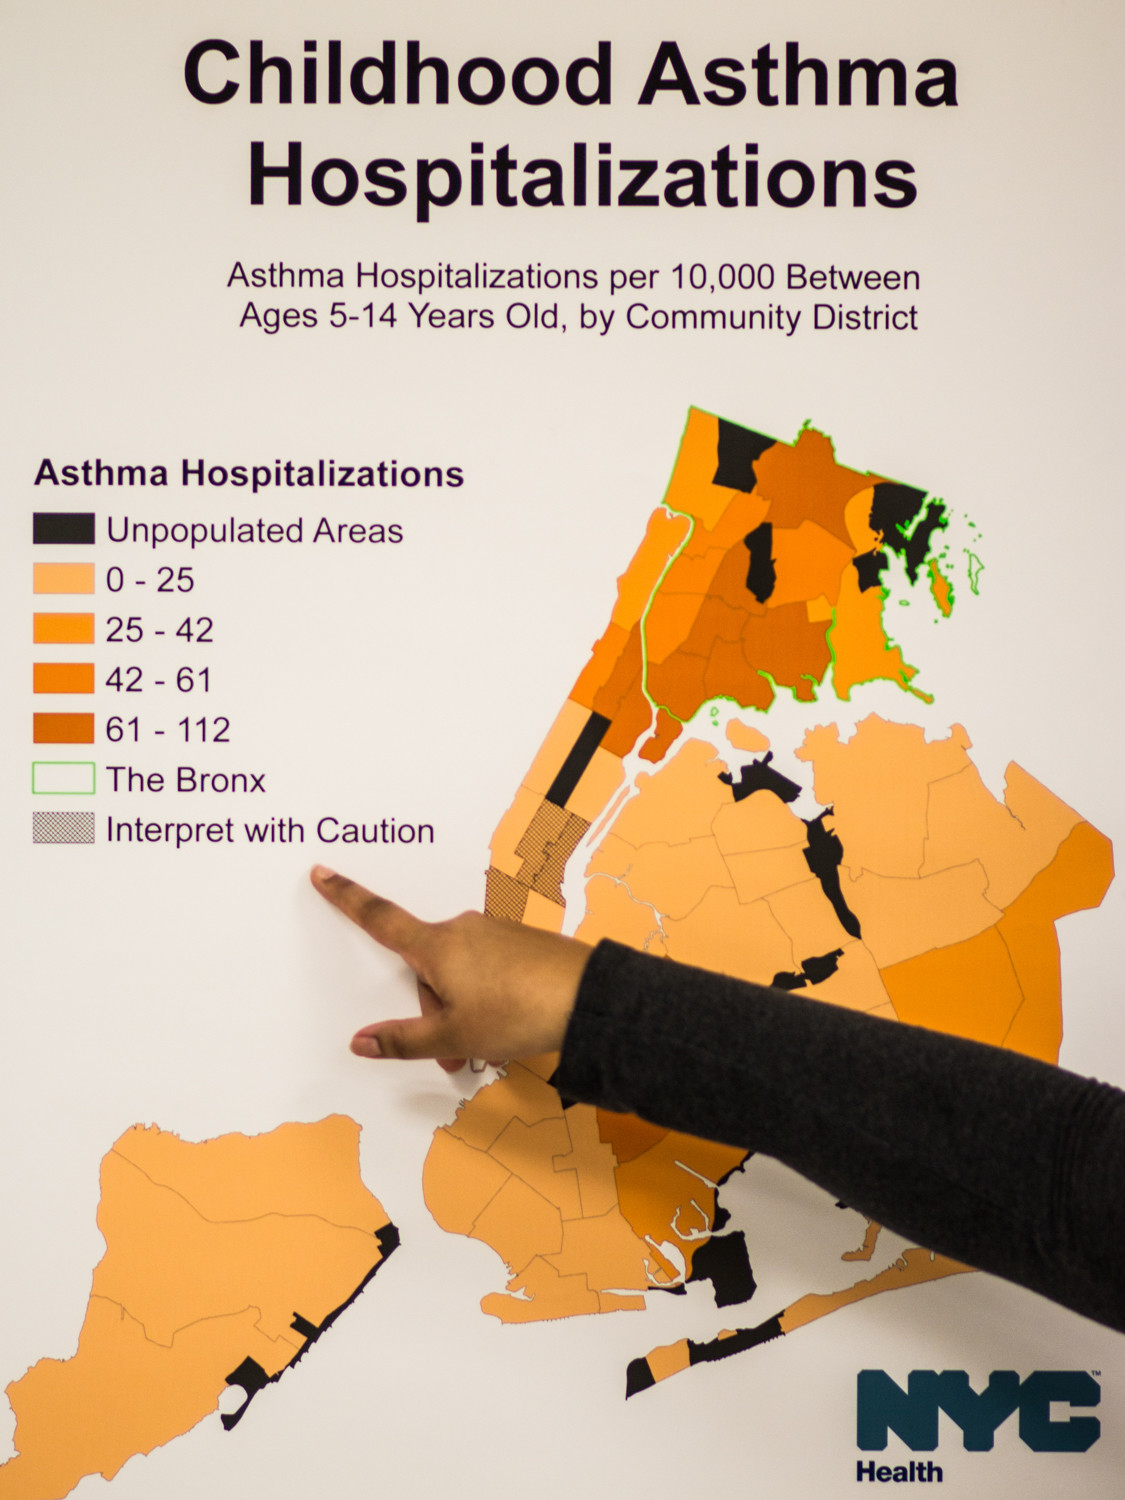
As part of its partnership with Designing the We, the city’s health department is exhibiting maps showing health disparities across the Bronx, making clear the links between redlining and the borough’s unfortunate distinction as the unhealthiest of the state’s 62 counties.
“The legacy of redlining persists in neighborhoods across New York City,” said Mary Bassett, the city’s health commissioner. “Redlining is directly connected to the ongoing health inequities that affect communities of color today.”
For more information on visiting the exhibit, visit tinyurl.com/UndesignTheRedline.
Keywords
Gregory Jost, Undesign the Redline, Designing the We, Mary Bassett, Richard Conley, Aaron Mayorga


